Metal material evaluation measurement function
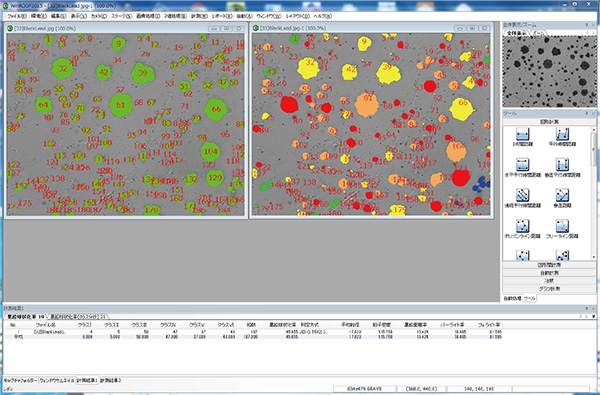
Graphite nodularity measurement
Measures the graphite nodularity of graphite cast iron.
<Calculated items>
・Roundness
・Number of classes
・Average particle size
・Pearlite/ferrite rate
It is possible to measure multiple fields of view at once and output to a custom template in Excel.
・Compatible standards
JIS G 5502
JIS G 5505
ISO 16112
Compatible with the new JIS law (JIS G 5502 2022 edition)
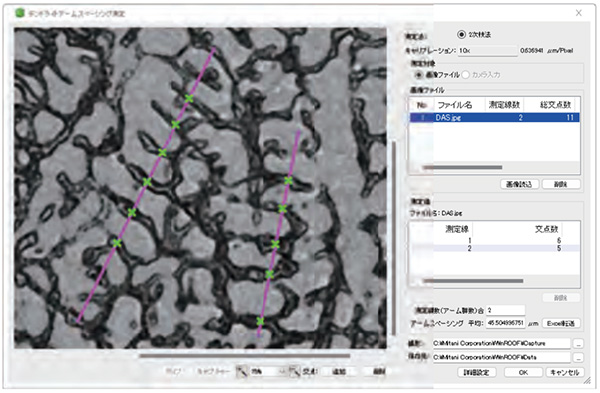
DAS measurement
Measures DAS (Dendrite Arm Spacing) of aluminum alloy ingots.
It is possible to automatically find the intersection just by pulling the arm.
<Calculated items>
・Number of measurement lines
・Total number of intersections
・Total arm group length
・Arm spacing
Reports can be output by saving in CSV or transferring to Excel.
・Compatible standards
No standard (secondary technique)
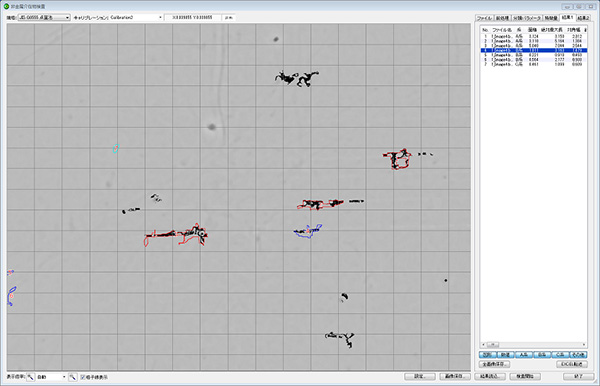
Nonmetallic inclusion measurement
Measures non-metallic inclusions in steel quality tests.
<Calculated items>
・Number, area, and size of inclusions detected using arbitrary parameters
・Classification of systems into A, B, C, etc.
・Cleanliness of each system
In addition to saving and loading condition parameters, reviewing past analysis results, measuring multiple fields of view at once, it is possible to output reports by saving in CSV or transferring to Excel.
・Compatible standards
JIS G 0555(point counting method)
ASTM E45(worst field of view method )
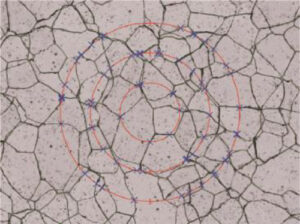
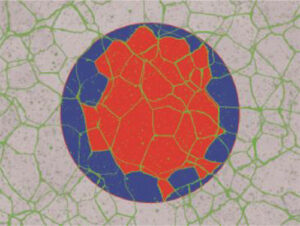
Grain size measurement
Measures the grain size of ferrite/austenite, copper, and wrought copper alloy materials.
| Cutting method |
Counting method (quadrature method)
|
 |
 |
<Calculated items>
・Grain size number (comparison method, cutting method, counting method (quadrature method) can be selected)
*For the cutting method and counting method (quadrature method), advanced automatic grain boundary detection using WinROOF macros is also possible.
Reports can be output by saving in CSV or transferring to Excel.
・Compatible standards
JIS H 0501
JIS G 0551
ASTM E 112
Other measurement functions
WinROOF can automatically perform various measurements such as automatic measurement of samples with many scattered particles, height and profile measurement of 3D data, and line width measurement of industrial products. Automatic measurement makes it possible to prevent human errors.
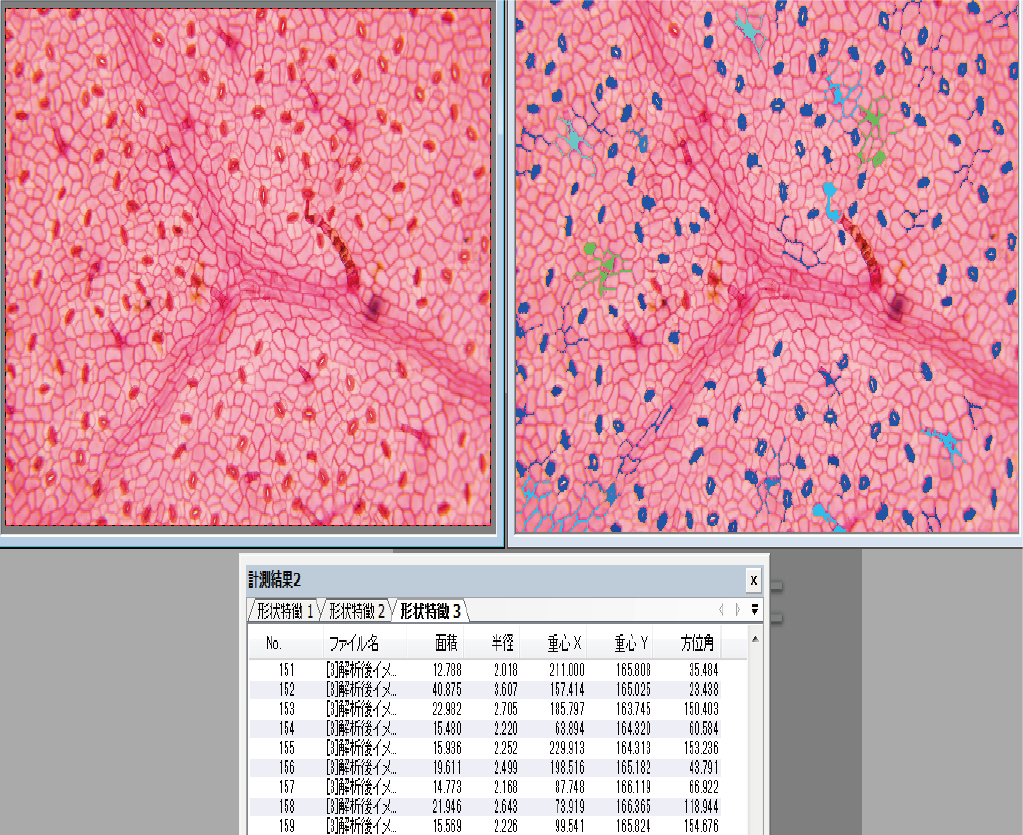
Particle measurement/statistics calculation
Condition classification based on particle feature values, separation of adjacent particles
It is possible to measure the shape of all kinds of particles and cells, from metal particles to animal cells.
By setting a range, it is also possible to measure the shape within the specified range.
Statistical data can also be calculated from the measured data at the same time.
Analysis from setting the extraction particle conditions to determining OK/NG can be measured instantly.
It also has a function to edit the state of extracted particles.
Equipped with an amazing multi-value function!
Equipped with a multi-value function that allows binarization processing to be performed multiple times. Various objects in images can be identified and measured.
This is a much-anticipated feature that eliminates the need to process the same image over and over again, allowing analysis work to be done in just one go.
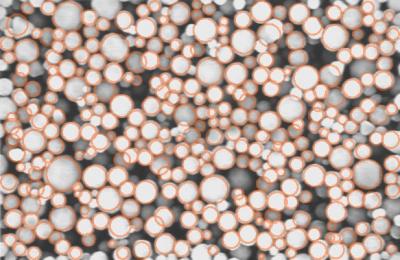
Circular/polygonal particle measurement
When particles overlap each other, it is difficult to perform normal particle analysis. With this function, it is possible to separate the overlap between these particles and measure their diameter, area, etc.
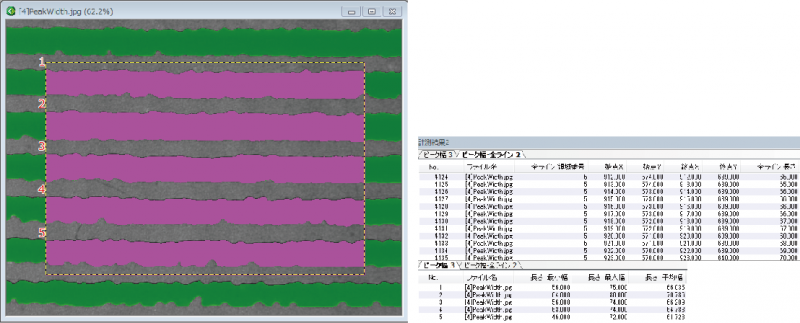
Automatic line width measurement
Automatically measures the line width for multiple lines lined up on the screen. At this time, in addition to each average width, you can also obtain all data for each line. It can be used to inspect defects such as narrowing of the width in a certain area. It also supports LER (Line-Edge Roughness) and LWR (Line-Width Roughness) that comply with SEMI standards.
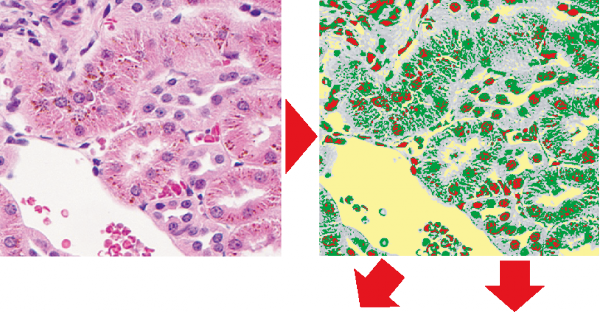
Color image analysis
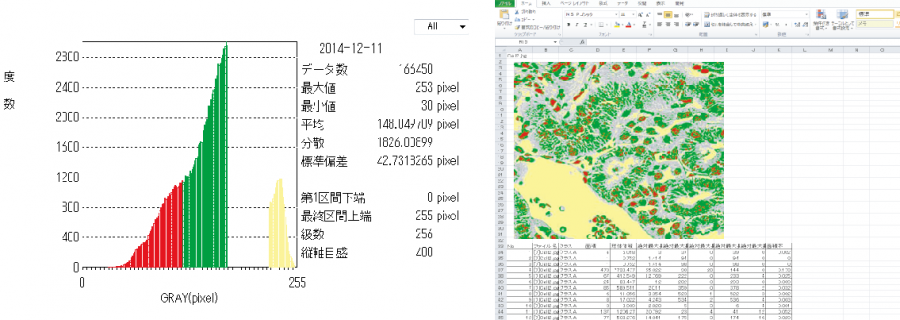
It is possible to extract specific colors (RGB, HLS) from color images and perform particle analysis. After analysis, it can also be applied to create frequency distributions and output Excel reports.
Height profile measurement
Height, width, and approximate R can be measured from the acquired 3D data.
*3D data in a compatible manufacturer format is required for analysis.
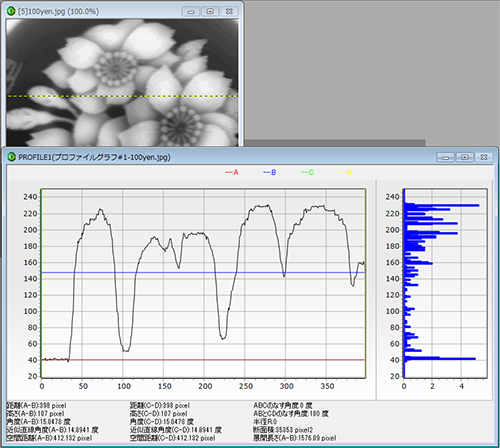
Concentration profile measurement
Profile measurement of concentration data on any line is possible.
In addition, the acquired data can be output to the measurement list.
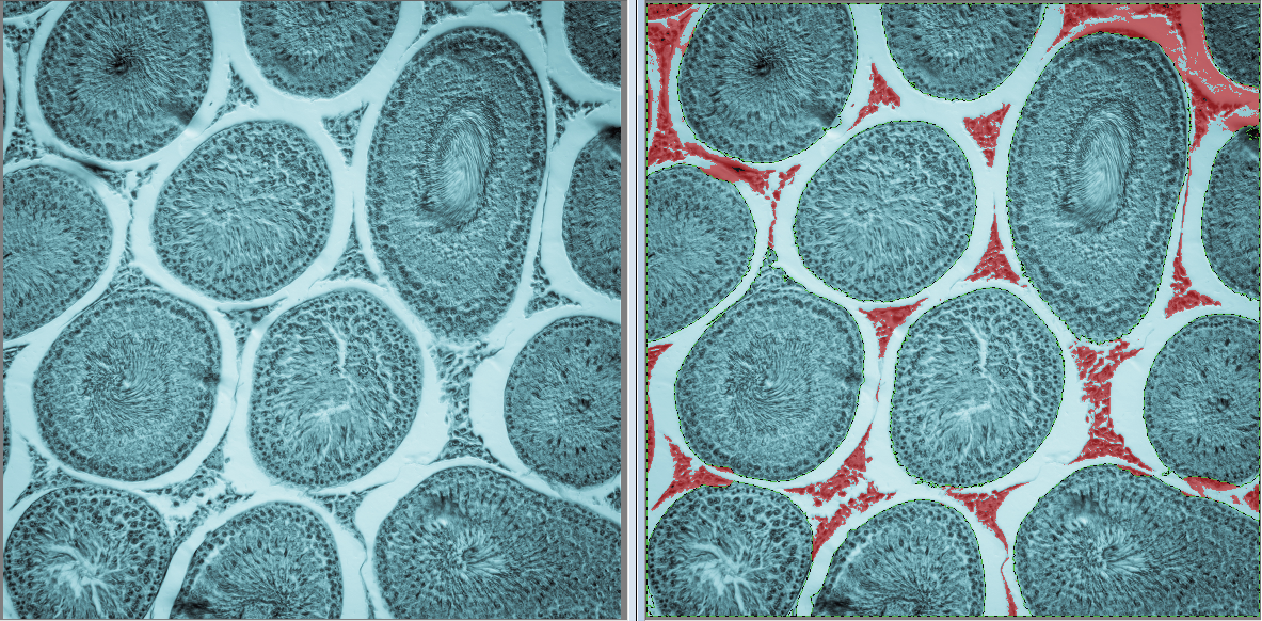
Special region (mask ROI) creation
It is now possible to create special regions (mask ROI) that could not be created with conventional measurement region creation tools (ROI). You can further specify and measure colors within the mask ROI.
Automatic processing tools
By using automatic processing tools, specific image analysis and measurement procedures can be registered as a single command. Registered commands can be called at any time from WinROOF, greatly improving your work efficiency.
Automatic processing tools
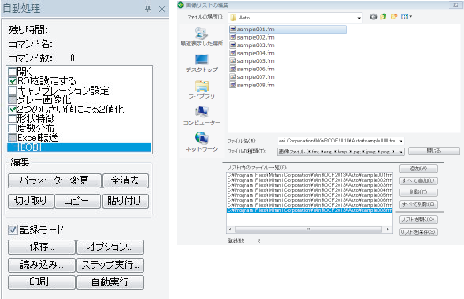
If the image analysis/measurement procedure is a standard one, you can analyze it efficiently by registering the procedure as one command.
To create automatic processing, you can create a macro by simply following the actual measurement steps in order. Also, if you want to change parameters for each measurement, just check the registered commands and you can make fine adjustments.
Toolbar/function key registration
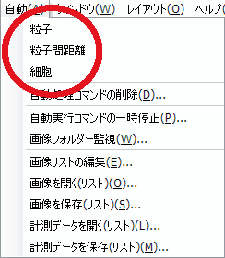
Created automatic processes can be registered to toolbars, menus, and function keys. When running an automatic process, you can use a shortcut by simply selecting the icon or command on the left. Up to 10 items can be registered in the toolbar.
Timer interval function
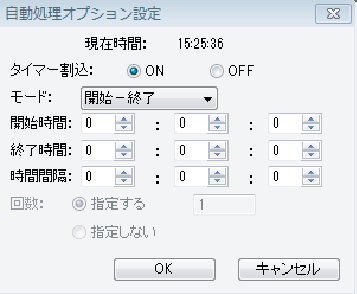
By using the interval function, it can be automatically executed repeatedly at fixed time intervals. It is possible to measure images that change over time. Additionally, by using the timer function, automatic processing can be executed at a specified time, making it possible to prevent omissions in measurement.
Application examples of automatic processing tools
①By using the timer interval function, you can perform time-lapse in conjunction with the camera.
Camera images are taken at set times and analyzes that meet the user’s requirements can be processed all at once.
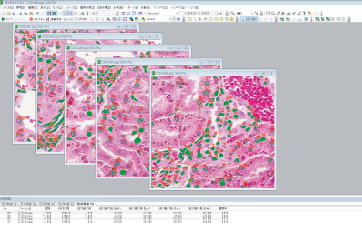
For example, by continuously analyzing each frame, it is possible to track the degree of change in the features of the object being photographed.
Please contact us for compatible camera models.
②This enables batch processing of a large number of images acquired under the same measurement environment (image size, imaging magnification, etc.).
You can significantly improve the efficiency of your work time.
③By using function key registration, anyone can measure the same data with a single button.
For example, all you have to do is press the registered button, such as the “F1” button to perform process A and the “F2” button to perform process B.
By combining extensive analysis functions, anyone can easily perform optimal processing.
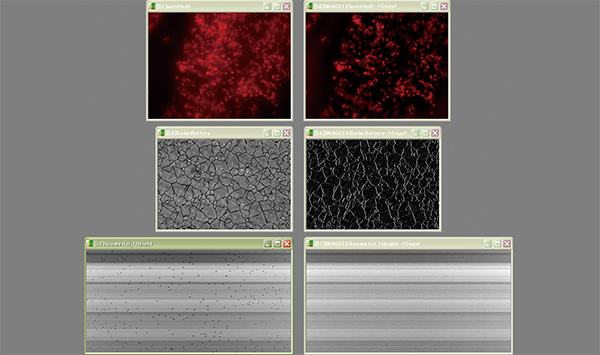
Filtering
It is possible to perform enhancement and improvement processing on various images such as microscopes, digital microscopes, SEMs, and X-ray CTs.
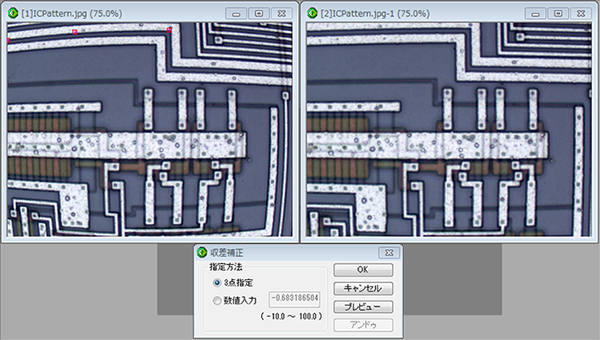
Lens aberration correction
Aberrations caused by lenses can greatly affect measurement results, but this function can correct these aberrations.
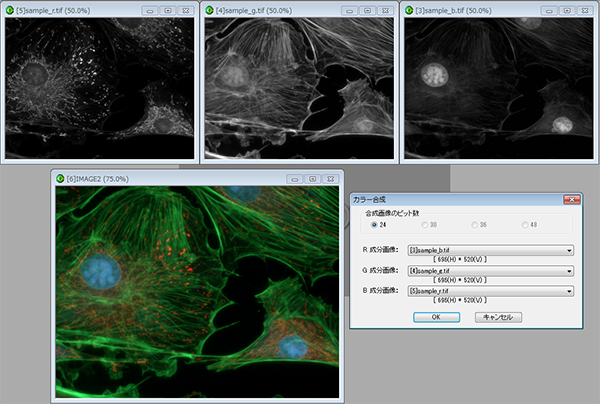
Multicolor composition (pseudocolorization)
This function allows you to combine captured fluorescent images and metal-containing images in pseudo color to observe the position of fluorescent markers, etc.
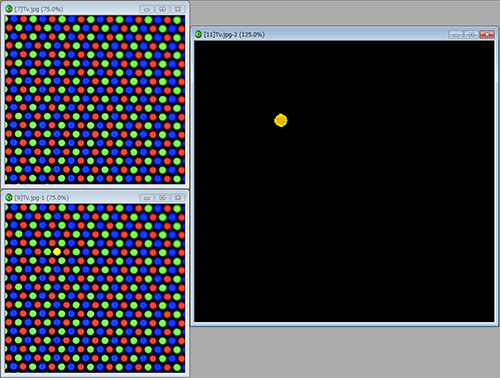
Image calculation
By performing calculations between images, OK/NG measurements such as missing dots can be easily performed.
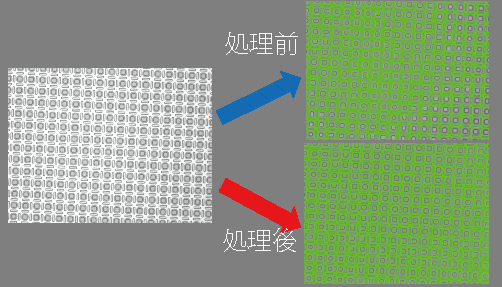
Light unevenness correction
Lens aberrations may cause the four corners of the image to become dark, but this function can be used to remove unevenness.
Filtering
You can create images that are effective for analysis by making full use of various filters, such as enhancing image edges and removing image noise.
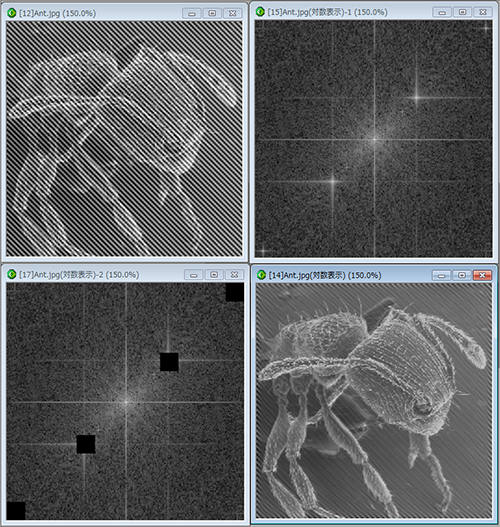
Fourier transform
It is possible to create a clearer image by replacing the image with frequencies and removing frequencies in certain areas.
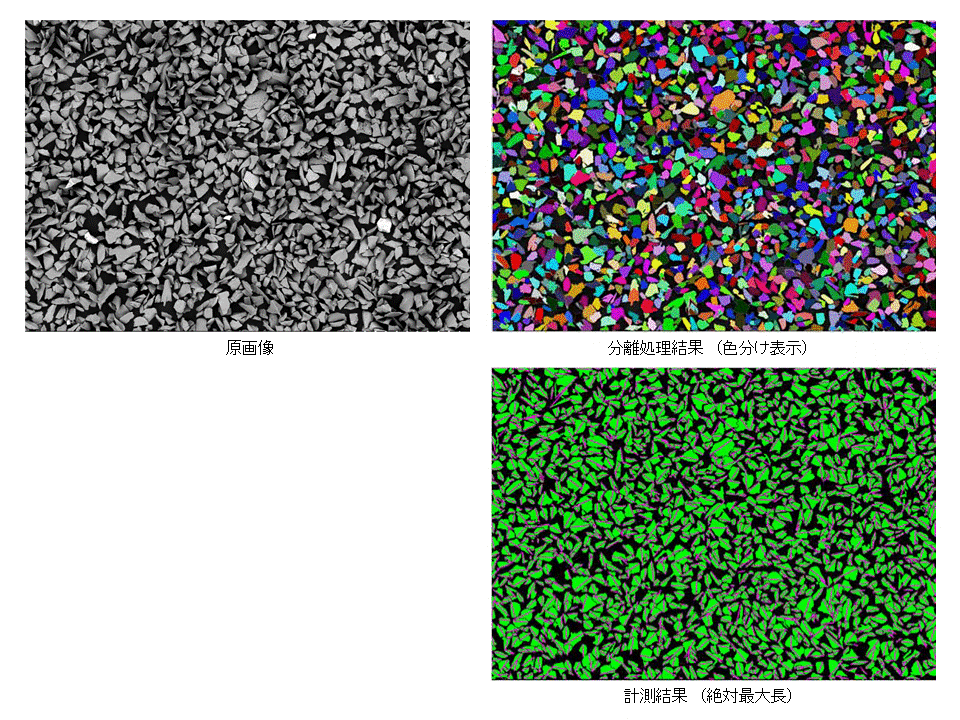
Watershed – Splitting dense particles
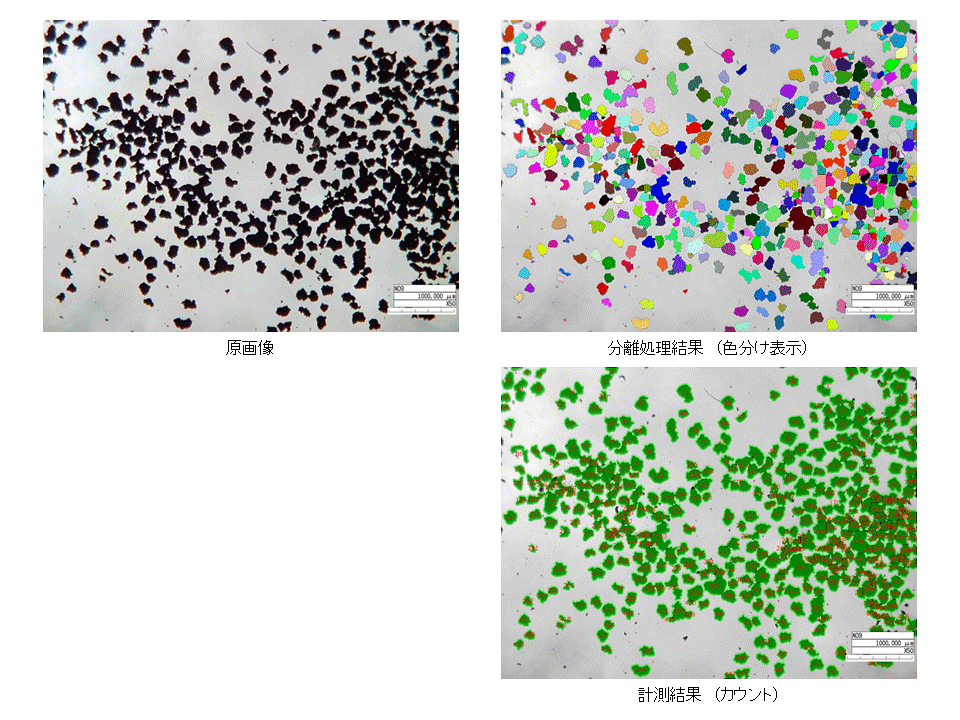
Watershed segmentation is one of the area segmentation methods, and is a function that identifies the connections between objects and effectively separates them when extracting objects that are likely to be connected with each other using normal binary extraction. It can also be applied to the analysis of connected colonies and cells on a petri dish, as well as the analysis of particles such as irregularly shaped powders.
Solving separation problems in image analysis
Watershed Segmentation refers to a watershed, basin, or fork in a river. An image is created in which the brightness increases from the edge toward the center of the particle, and the brightness gradient of the image is regarded as a mountain ridge, and the area created by water flowing from a high position on the mountain is divided into one area. It is called this because of the algorithm that performs this.
We provide a new solution for analyzing particles and cells that are difficult to extract and count using conventional image analysis. Even if the particles scattered on the screen have various shapes, their constrictions can be recognized and separated.
Even particles that are difficult to extract can be accurately separated and counted and measured.
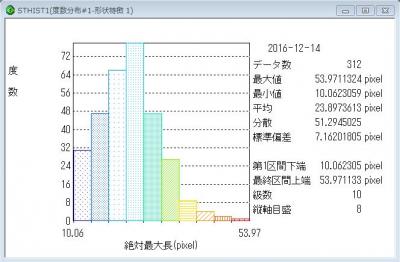
Spaces without particles are not processed, and all particles can be counted. After processing, the shape characteristics of each particle (area, equivalent circle diameter, absolute maximum length, acicular ratio, etc.) can be measured, and particle size distribution etc. can also be evaluated.
Main features
WinROOF 2023 Standard is capable of many analyzes and measurements such as particle measurement using binarization, circular separation measurement, focus synthesis, metal grain boundary separation function, and roughness measurement.
Manufactured by Mitani Shoji Co., Ltd.
Features of high-performance image processing/image analysis software WinROOF 2023 Standard
●Various measurements can be performed automatically, such as automatic measurement of samples with many scattered particles, height and profile measurement of 3D data, and line width measurement of industrial products. Automatic measurement makes it possible to prevent human errors.
●By using automatic processing tools, specific image analysis and measurement procedures can be registered as a single command. Registered commands can be called at any time from WinROOF, greatly improving work efficiency.
●Filter processing: It is possible to perform enhancement and improvement processing on various images such as microscopes, digital microscopes, SEMs, and X-ray CTs.
●One of the charms of WinROOF2023 is its rich optional functions. It is capable of achieving high scalability, and is designed to meet the needs of each field, assuming a variety of cases required in a variety of fields, from automobiles to manufacturing, rubber, road surfaces, cylinders, resins, and printing.
●Watershed – Segmentation of dense particles: Watershed segmentation is one of the area segmentation methods. When extracting objects that are likely to be connected to each other using normal binarization extraction, it is possible to identify the connections between them and effectively separate them. This is a function to It can also be applied to the analysis of connected colonies and cells on a petri dish, as well as the analysis of particles such as irregularly shaped powders.
Useful features of WinROOF 2023 Standard
Features
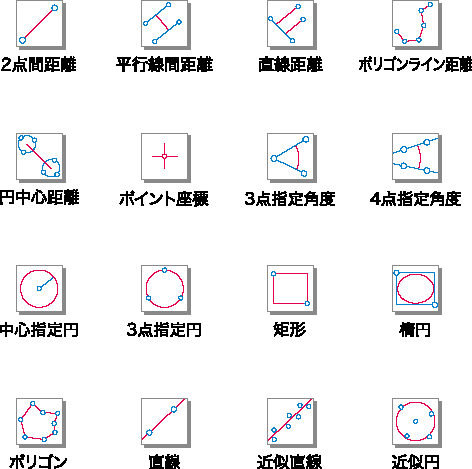
Abundant dimension measurement tools
Equipped with a coordinate setting tool, it is possible to measure in the workpiece coordinate system even during on-screen measurements. It also supports dimension measurement in various situations such as distance between two points, angle, number of pieces, circle, rectangle, polygon, etc. Furthermore, approximation tools are also available to handle ambiguous circles, lines, etc.
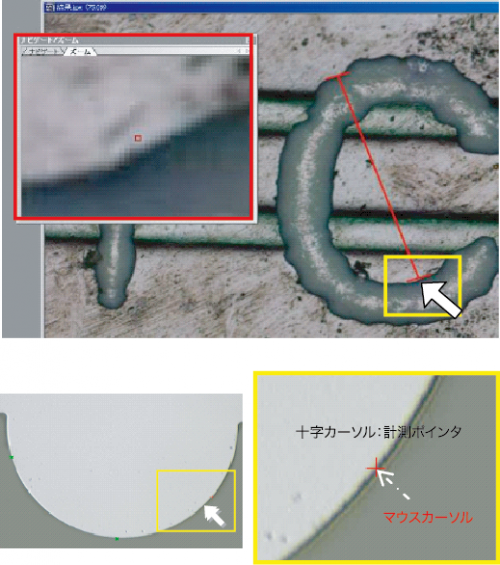
Measurement assist function
Enlarges the point pointed by the mouse cursor when supporting a measurement point. It reduces errors caused by mouse clicks and enables more accurate measurements. You can also adjust the magnification rate and display the grid. You can also easily scale the image by scrolling with your mouse.
When the mouse cursor is brought close to the edge, human error by the fit measurer is automatically reduced and accurate measurements are possible. This function automatically fits the edge when you click near the edge when supporting a measurement point. It can be applied to all scenes to be plotted, such as when setting calibration or when specifying measurement pointers for multiple points.
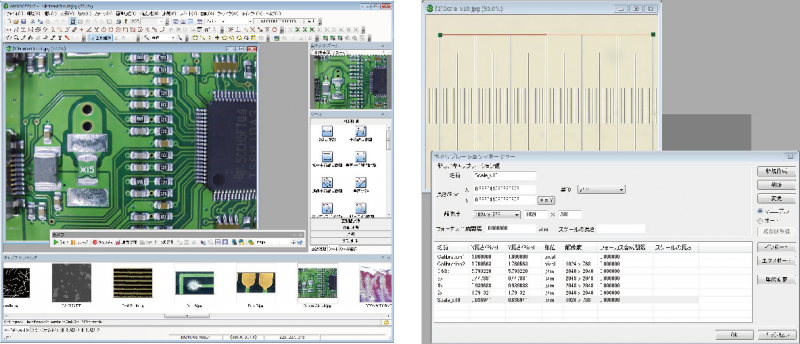
Camera control & scale settings
Camera control allows automatic image storage and database creation.
Comments can be entered when registering a calibration, so even if there are multiple input devices, you can select one without making a mistake.
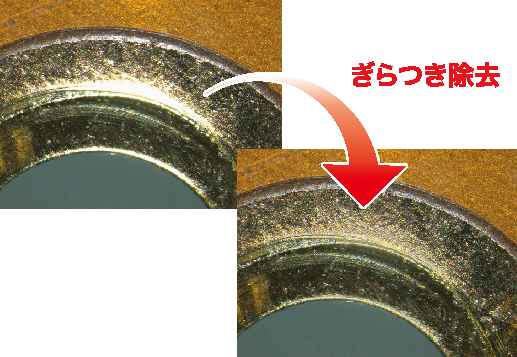
Halation removal/HDR synthesis
By using unique image processing when photographing glossy samples, it is possible to suppress glare in the image and generate an optimal image without reducing the image quality of the surrounding areas. The operation is as simple as adjusting the lighting and camera exposure, so you can instantly adjust it to suit your sample.
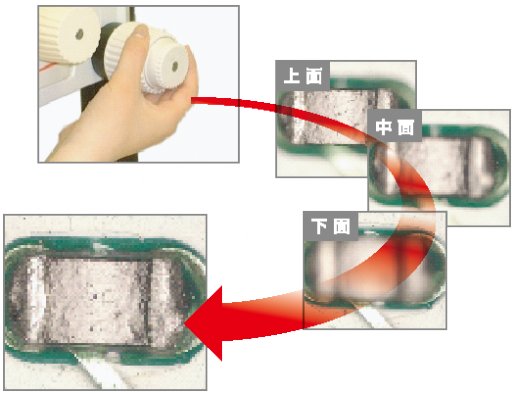
Focus compositing
Even if the sample is tall and out of focus in the image, an all-in-focus image can be easily generated by simply turning the microscope’s focus adjustment dial.
*Please contact us separately for compatible devices.
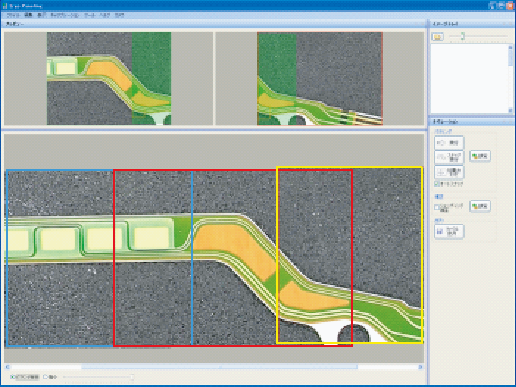
Image concatenation
The margins (overlaps) are automatically recognized through pattern matching, allowing anyone to easily generate connected images. There is no specification of the number of vertical and horizontal images to be combined, and automatic interpolation function that eliminates image seams and shading correction function that eliminates uneven light improve the accuracy of stitching.
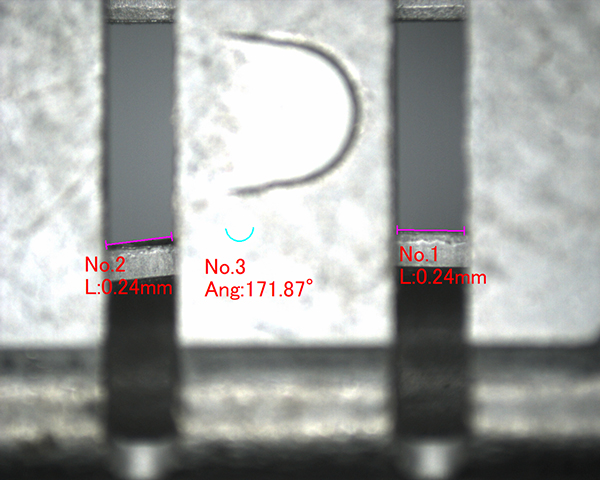
Distance measurement between figures
Select measurement lines 1 and 2 and measure the angle of the two lines
Operating environment
| Compatible OS |
Windows 10, 11(64bit) |
| Language |
Japanese/English available |
| CPU |
Core-i5 equivalent or 2.0GHz or higher |
| Memory |
8GB or more (64bit)
|
| Recommendation |
Internal or external DVD-ROM drive |
| Display |
Full color 1280×1024 or higher |
| Interface |
USB3.0 port for camera x 1
USB2.0 port or higher for USB key x 1
|

