Main features
Automated and manual particle analysis
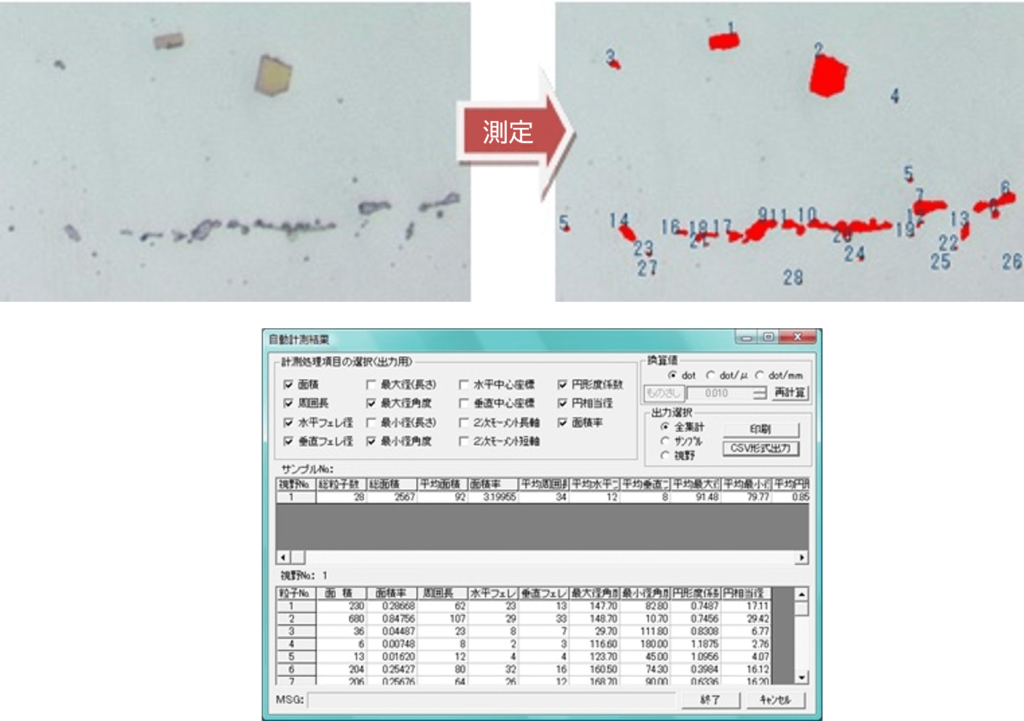
【Analyze with the touch of a button!Automated Particle Analysis】
・Instantly display the image analysis results of the entire image and individual data at the touch of a button.
【It is possible to measure the area of each particle! Manual Particle Measurement】
・Manual particle analysis enables measurement of individual areas of particles clicked on a binary image.
【Convenient for report creation! Excel Output】
・It is possible to select image measurement items and display actual size values (dot/mm or dot/μm).
・Results can be output in Excel (CSV format).
Crystal grain size measurement (ferrite grain size measurement of steel)
【Compliant with JIS and ASTM standards! 】
This is a grain size evaluation tool that complies with the following standards.
・JIS standard (JIS G 0551:2005)
・ASTM standards (ASTM E 112-96, ASTM E 1382-97)
【Up to 12 types of particle size measurement possible!】
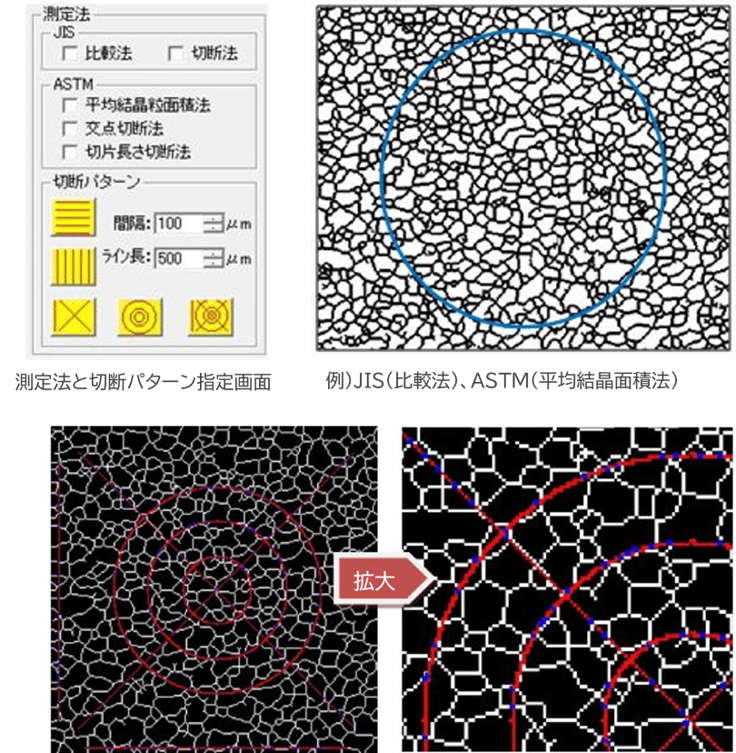
・The evaluation method is to perform up to 12 measurements at the same time depending on the combination of cutting patterns, and calculate the particle size number.
【You can choose from 5 different cutting patterns!】
・For the cutting method, you can select from 5 types of cutting patterns and set the spacing and line length.
【Convenient for report creation! Excel Output】
・The measurement results of grain size can be output to Excel (CSV format).
<Measurement display example> ASTM (intersection cutting method, intercept length comparison method)
In the display after measurement, areas where grain boundaries overlap the cutting pattern are displayed in blue.
*The image example is a measurement of a range of 1000×1000 dots with a microscope magnification of 100x.
Image measurement function
【There are 11 types of image measurement processing possible!】
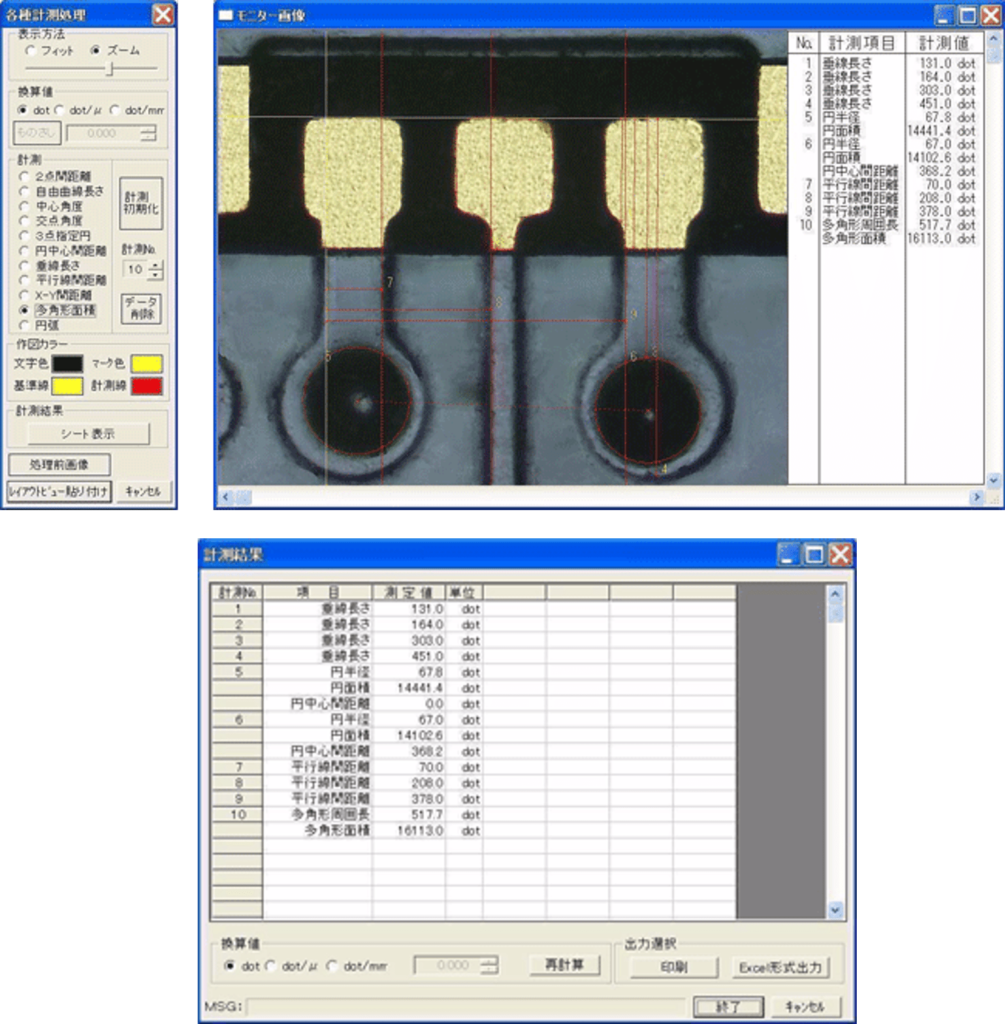
・ Image measurement can be performed by combining 11 types of image measurement processing such as distance, angle, and area.
【Convenient for report creation! Excel Output】
・ Image measurement results can be output to Excel (CSV format).
Other features
Equipped with various image analysis tools!
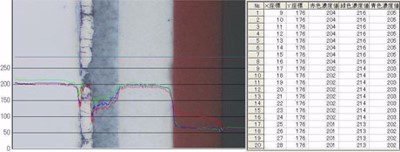
【Profile analysis】
・ In the area selected from the box box and line, the luminance distribution can be displayed for each color.
*The distribution map can be selected from the vertical and horizontal directions according to the purpose.
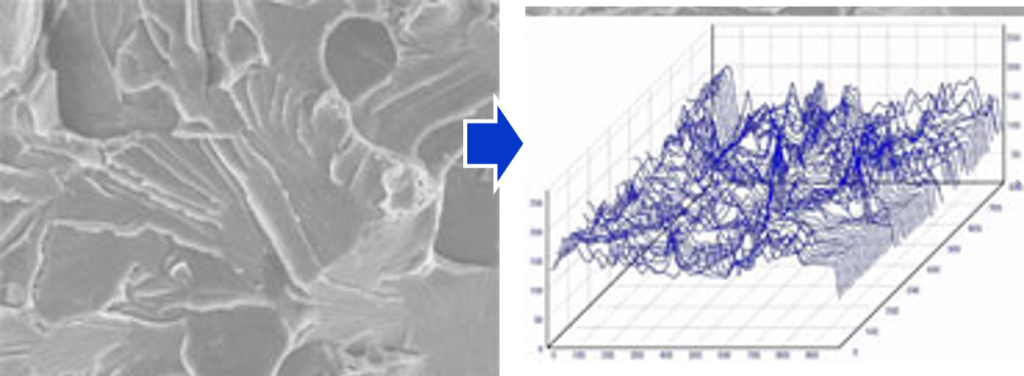
【3D display】
・Separates the RGB contained in an image into components and depicts a three-dimensional graph of the intensity distribution.
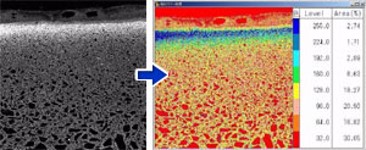
【Pseudo color processing】
・Colorizes monochrome images according to their brightness gradation.
・Able to calculate area ratio for each gradation. (You can color up to 256 levels.)
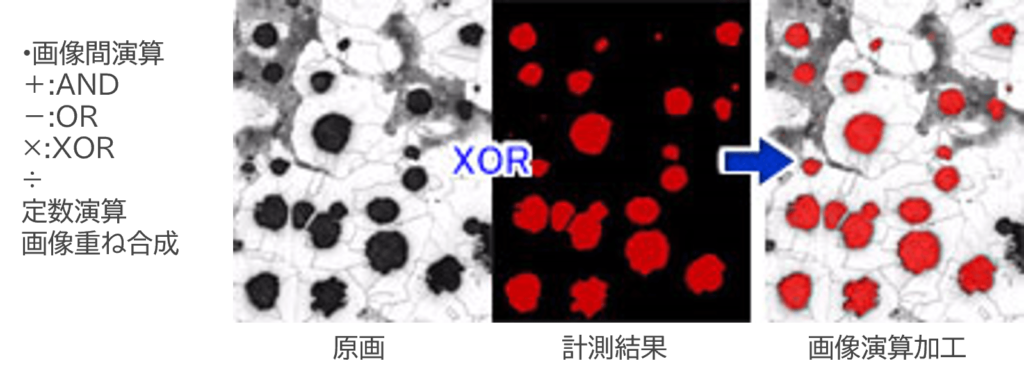
【Image calculation processing】
・Image processing using arithmetic and logical operations between two images or with constants.
Equipped with convenient tools for preprocessing image analysis!
【Brush image processing】
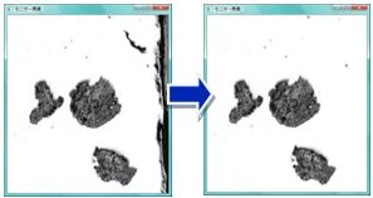
・Overpaint the image with a brush of any size to correct the object of particle analysis.
【Measurement area specification】
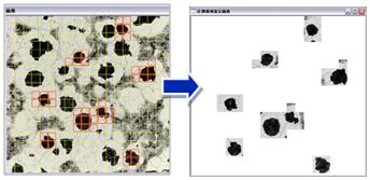
・Measurement areas can be specified using rectangles, ellipses, polygons, free areas, and grids.
<Example of grid area specification>
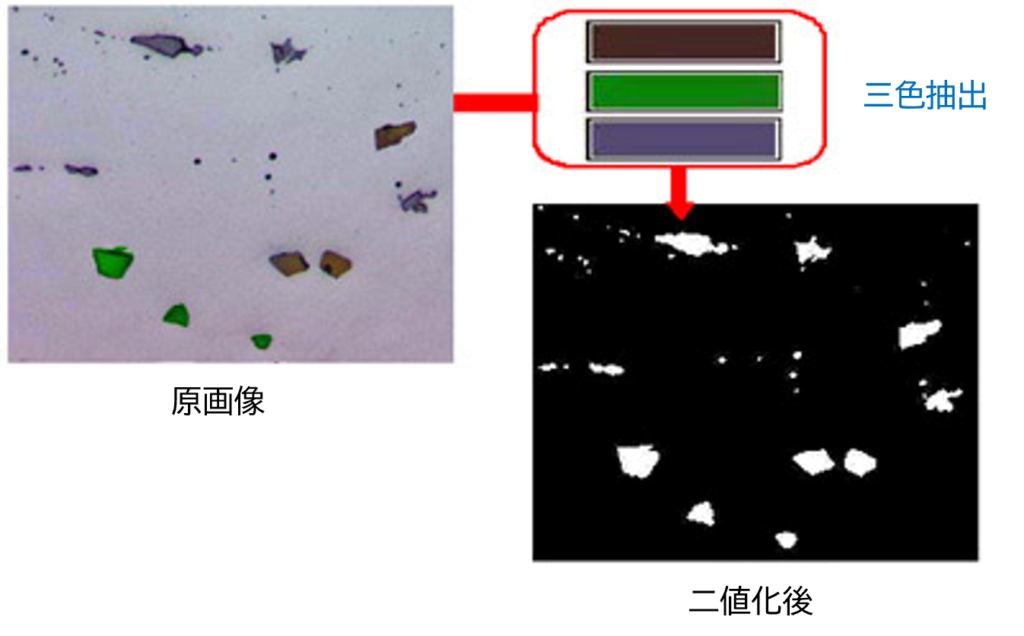
【Binarization by color component extraction】
・Extract any color and binarize it at that color level.
*Up to 3 colors can be specified.
Equipped with a “simple menu” that allows you to easily process images!
【Simple menu】
・Frequently used functions are consolidated into a simple menu.
・Easy image processing is possible with a click. (Excluding particle image manipulation and unnecessary particle deletion functions)
Analysis result image can be displayed as an overlay!
【Overlay display】
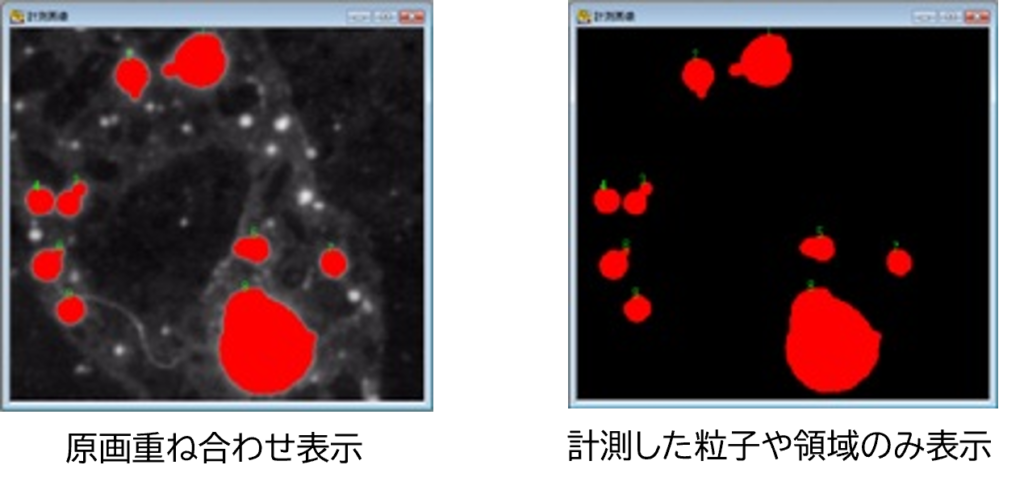
・The results of automatic particle analysis can be displayed as an overlay on the original image.
*Measured particles and areas can be determined at a glance.
・Only the measured particles and areas can be displayed.
・Numbering display of measured particles and colors of particles and regions can be changed freely.
More convenient optional features
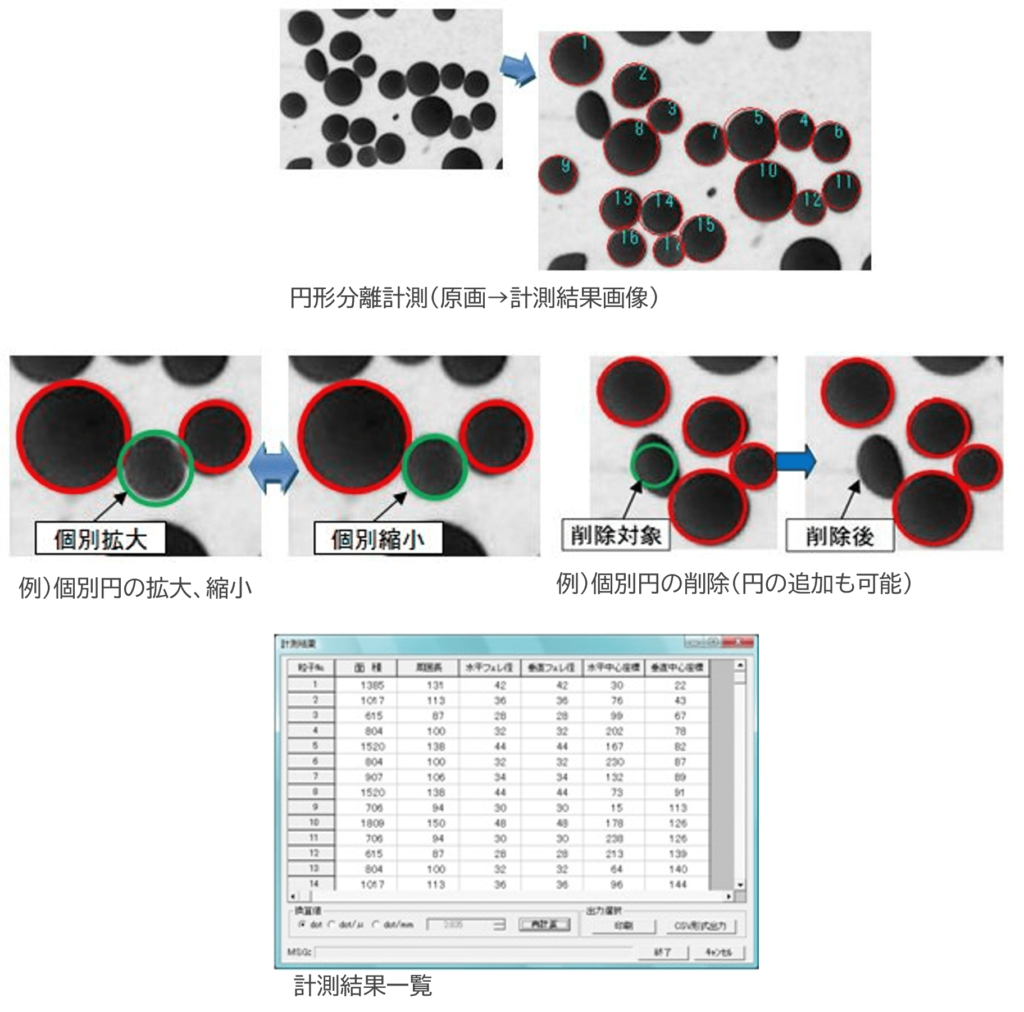
Circular separation measurement (optional function)
・ Overlapping particles can be automatically separated into circular particles, and image analysis can be performed on each individual particle.
・You can add or delete individual circles and fine-tune the size of the circles as you like before measurement.
We accept customization
・We can customize the software according to your requests.
<Customization example>
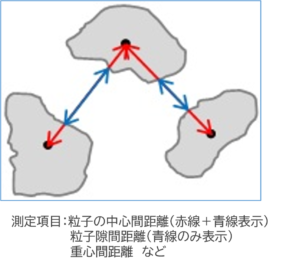
◆ Interparticle distance measurement
Automatically measures the distance of surrounding particles from one particle as a base point.
Distance measurement results are calculated for each particle that becomes the base point.
We also offer systems that automatically measure the distance between particle center coordinates and center of gravity coordinates, and directly capture microscopic images from a camera and perform image analysis, so please contact us for details.
*Optional customization will be charged separately.
Operating environment
| Supported OS |
Windows10 Pro |
| CPU |
Core i5 3.0GHz equivalent |
| Ram |
8GB or more recommended |
| Image resolution |
1280×1024 or higher |
| HDD |
128GB or more recommended |
| Peripheral equipment |
CD-ROM drive (required during installation), 1 USB port |

